

 Artificial Intelligence
 Machine Learning
 Unsupervised Learning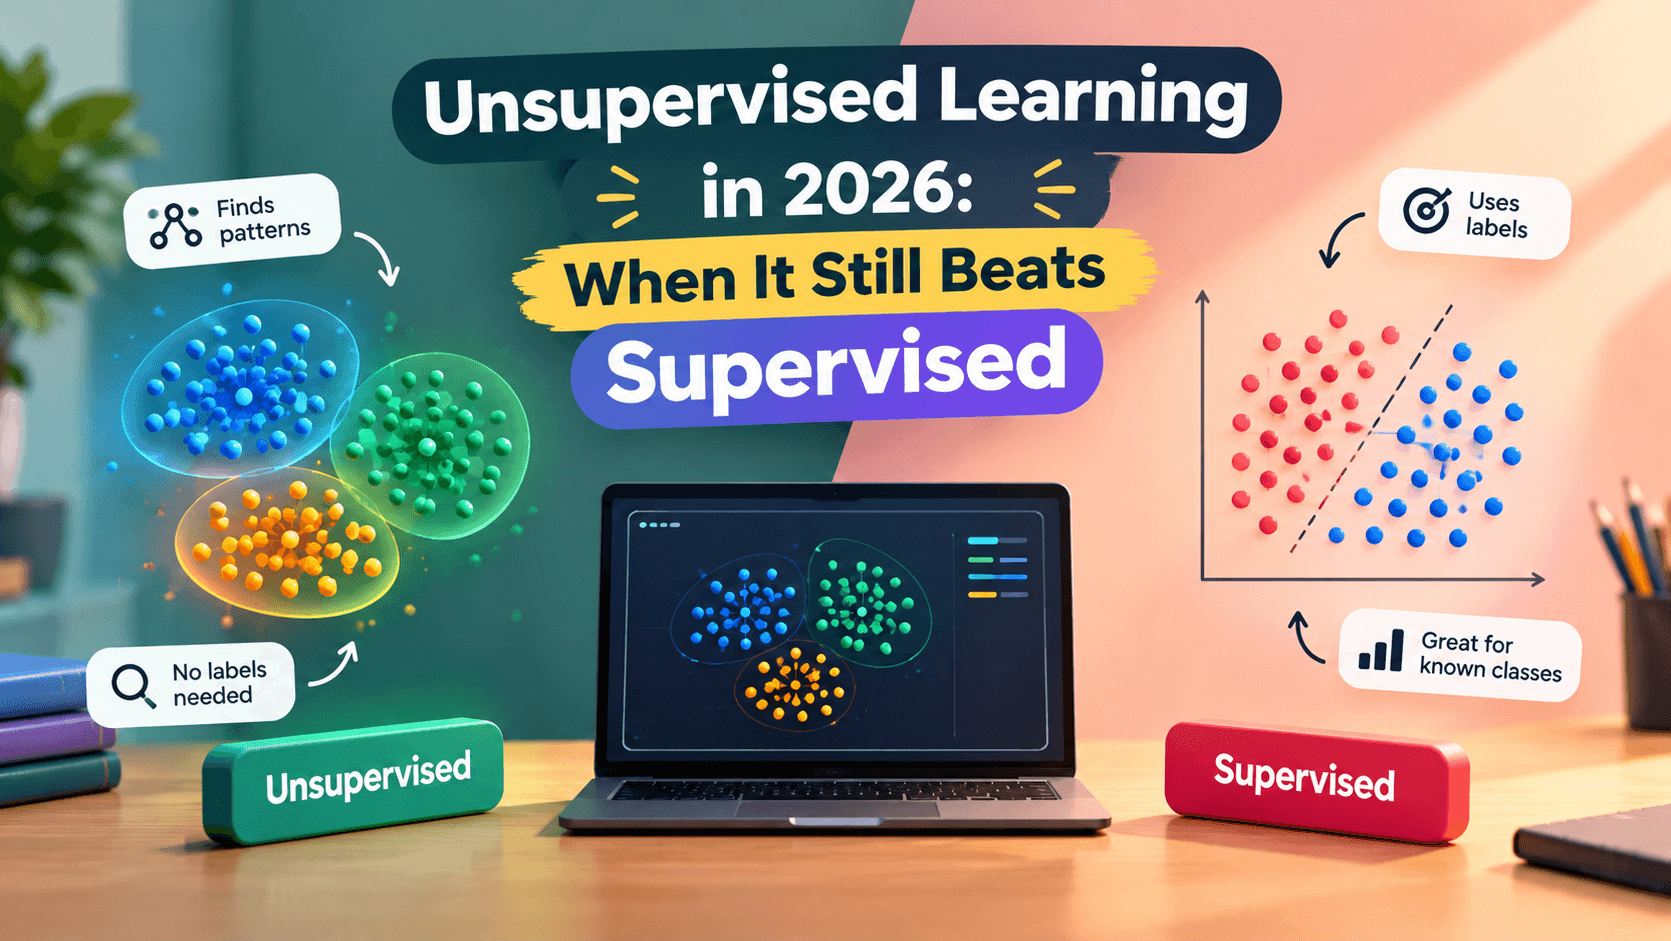

At 9:17 on a Monday morning, a dashboard can show five tidy groups and still tell a completely false story. The interesting part of unsupervised learning isn't making colored dots; it's discovering useful structure, then proving that result survives fresh data and skeptical humans.
Why This Matters
Modern teams collect far more unlabeled data than reviewed examples. A marketplace records searches, carts, refunds, and support conversations every second, while only a small slice receives a trustworthy human label. Security teams face the same imbalance: billions of routine events and a handful of confirmed incidents. Labeling everything is slow, expensive, and sometimes conceptually impossible because the categories haven't been discovered yet.
That gap grew more important from 2024 through 2026. Embedding models made text, images, audio, and code available as dense vectors; lakehouse platforms made years of behavior queryable; and cheaper accelerators made large representation-learning jobs practical. Better infrastructure didn't remove the oldest danger: an algorithm will always return something. A cluster It would isn't a customer persona, an anomaly score isn't fraud, and a two-dimensional projection isn't proof that nature contains two tribes.
The cost of getting this wrong is operational. Imagine suppressing alerts for a supposedly “normal” device cluster that actually combines office laptops with compromised build agents. Or imagine giving a 20% coupon to a segment defined mostly by missing analytics events. Those aren't academic errors. They create incident-response gaps, wasted marketing spend, and decisions that become harder to reverse after dashboards and quarterly targets depend on them.
Unsupervised work matters because it creates hypotheses cheaply. Done well, it narrows a giant space into a reviewable queue, reveals structure that labels conceal, and produces representations reusable by downstream systems. Done badly, it converts measurement quirks into confident-looking fiction. The discipline lies in knowing which outcome you're producing.
The Core Idea
Unsupervised Learning learns structure without receiving the final answer for every row. Depending on the task, “structure” may mean compact groups, low-dimensional directions, dense neighborhoods, latent representations, or observations that are difficult to explain under a model of normality. The absence of target labels doesn't mean the absence of assumptions. Every method carries an opinion about distance, density, smoothness, reconstruction, or graph connectivity.
Start with representation. A distance algorithm operating on raw columns treats those columns as a coordinate system. If annual revenue ranges into millions while visit frequency stays below one hundred, revenue can dominate unless values are transformed. Categorical identifiers are worse: assigning Berlin=1 and Tokyo=9 invents arithmetic that doesn't exist. Text embeddings offer a stronger semantic space, but they inherit the embedding model's training data, truncation behavior, and blind spots. Representation is often more consequential than the clustering algorithm selected afterward.
Next comes objective. Centroid methods minimize within-group squared distance. Density methods search for connected high-density regions and may reject sparse points as noise. Graph methods cut a similarity network. Reconstruction models learn to reproduce typical inputs and use error as a signal. These objectives answer different questions. Asking which algorithm is universally “best” is like asking whether a map should optimize walking time, elevation, or political boundaries. The correct map depends on the trip.
Evaluation is awkward because there may be no ground truth. Internal metrics such as silhouette score reward separation and compactness, but can favor simple shapes that aren't useful. Stability asks whether similar samples and random seeds produce similar assignments. External validation uses later outcomes—retention, incident confirmation, conversion—without training directly on them. Human review checks coherence and actionability. Strong projects combine all four rather than worshipping one number.
There's also a distinction between exploration and production. During exploration, it's reasonable to try several feature sets and inspect plots. Production needs a fixed preprocessing pipeline, versioned artifacts, deterministic settings where possible, monitoring, and a policy for new observations. Some algorithms naturally predict a cluster for a new row; others must be refit or wrapped with an approximation. That seemingly small API detail changes how safely the system can be deployed.
Distance deserves careful treatment. Euclidean distance measures a straight line and works naturally with standardized continuous variables. Manhattan distance can be more robust when changes accumulate independently. Cosine distance focuses on direction, making it useful for normalized embeddings. None is automatically correct. A ten-dollar increase and ten-day delay can't be compared until the team decides what those movements mean.
Dimensionality adds another trap. In high dimensions, distances can concentrate: the nearest and farthest neighbors become surprisingly similar. Irrelevant features create extra routes for noise to influence results. Feature selection, PCA, learned embeddings, or domain-driven aggregation can restore useful geometry, but reduction may discard rare signals. Treat it as a modeling decision, not a visualization convenience.
Finally, remember that outputs are coordinates for conversation, not discovered truth. Cluster 2 becomes useful only after someone can describe its behavior, estimate its size, identify representative examples, and choose an action. If two groups receive exactly the same treatment, maintaining separate groups may add complexity without value. The model's job is to expose structure; the team's job is to decide whether that structure deserves a name.
A Concrete Example
Consider a subscription business trying to understand customer behavior before it has reliable churn labels. The raw event table contains hundreds of columns, but the first useful model should stay small enough to reason about. We choose recent order count, revenue, and recency. Those features encode frequency, monetary value, and disengagement while avoiding personal attributes that could turn segmentation into accidental discrimination.
Create an isolated environment and install current scikit-learn and pandas releases:
python -m venv .venv
source .venv/bin/activate
python -m pip install -U pandas scikit-learn
Here is a complete, runnable baseline:
import pandas as pd
from sklearn.cluster import KMeans
from sklearn.pipeline import make_pipeline
from sklearn.preprocessing import StandardScaler

customers = pd.DataFrame({
    "orders_90d": [1, 2, 3, 12, 15, 11, 2, 4, 18, 14, 1, 9],
    "revenue_90d": [35, 80, 95, 900, 1400, 820, 55, 160, 2100, 1250, 25, 700],
    "days_since_order": [80, 45, 22, 3, 7, 5, 92, 30, 2, 10, 120, 8],
})
features = list(customers.columns)
model = make_pipeline(StandardScaler(), KMeans(
    n_clusters=3, n_init="auto", random_state=42))
customers["segment"] = model.fit_predict(customers[features])
print(customers.groupby("segment")[features].mean().round(1))
The pipeline matters more than its compact size suggests. Scaling is fitted inside the pipeline, preventing the training transformation from drifting away from the model. A fixed random seed makes experiments reproducible. The printed summary translates machine IDs into observable behavior; without that profile table, labels such as 0 and 2 have no meaning.
On a real dataset, keep a time-based holdout. Fit on January through March, then transform or score April without recalculating every statistic from the future. For clustering, compare centroids and assignment rates across periods. For anomaly detection, measure how many top-ranked events reviewers confirm. For reduction, test whether downstream accuracy, retrieval quality, or runtime improves. The holdout isn't merely for supervised learning—it detects brittle structure and temporal leakage.
A useful review table includes the group size, medians, robust percentiles, missing-value rates, and five representative records nearest the cluster center or most responsible for an anomaly score. Means alone hide long tails. Representatives make abstract structure tangible: a support analyst can tell whether five “high-value” customers actually share behavior or merely share one enormous refund.
Now run sensitivity checks. Change the random seed, vary the requested cluster count, remove one feature family, and bootstrap the rows. Match resulting groups using centroid distance or overlap, then report stability rather than silently selecting the prettiest run. If tiny configuration changes completely rewrite the story, you've found an exploratory visualization—not a production segmentation.
The final step is an experiment. Suppose one stable group buys frequently but hasn't returned for three weeks. Randomly offer half of eligible members a reminder and hold the rest as control. Measure incremental conversion and unsubscribe rate. This closes the loop: unsupervised discovery proposes a cohort, while a controlled test determines whether acting on it causes value. No cluster metric can substitute for that evidence.
For text or images, the same workflow applies with a different representation. Generate embeddings in batches, store the embedding model name and version, normalize vectors if cosine similarity is intended, and cluster or rank them. Review real examples rather than nearest-neighbor distances alone. In 2026, embeddings make prototypes quick; disciplined evaluation keeps those prototypes honest.
Deployment adds one final layer. Serialize preprocessing and estimation together, record library versions, and log input schema checks. Run the candidate beside the current system before changing decisions. A shadow period reveals whether group sizes, anomaly rates, or latency differ from the notebook. Define rollback conditions—such as a doubled alert rate or a vanished high-value segment—before release, while everyone is still calm.
Common Pitfalls
Treating preprocessing as housekeeping. Scaling, log transforms, missing-value indicators, and categorical encoding define the geometry. Fit transformations only on training data and version them with the estimator. If a feature measures revenue, consider
log1p; otherwise one enterprise account can pull a centroid across the map.Choosing parameters from the prettiest plot. Two dimensions can distort neighborhoods, especially with t-SNE or UMAP. Select parameters using stability, domain constraints, review quality, and downstream outcomes. Keep visualization for diagnosis, not as the sole objective function.
Reading cluster IDs as ordered categories. Label 2 isn't larger or better than label 1, and IDs can permute after retraining. Persist semantic profiles and match new clusters to old ones explicitly. Downstream code should never assume
segment == 2forever means “champions.”Ignoring noise, rare groups, and missingness. An outlier may be fraud, a data pipeline bug, or a legitimate edge case. Missing values may encode product behavior rather than absence. Report these populations separately and route uncertain cases to review instead of forcing every point into a confident narrative.
Evaluating on the same snapshot used for discovery. Repeatedly tuning against one dataset rewards accidental structure. Reserve later periods, rerun with bootstraps, and define acceptance criteria before selecting the final configuration. Stability across time is usually more valuable than a tiny gain in silhouette score.
Skipping operational design. Ask how new rows are assigned, how often refitting occurs, what triggers rollback, and who owns interpretation. Monitor feature distributions, group proportions, distance-to-center, noise rate, and business outcomes. A notebook that can't answer those questions isn't yet a service.
When to Use This (And When Not To)
Use unsupervised learning when labels are unavailable, stale, expensive, or unable to express the question. It's well suited to exploration, cohort discovery, deduplication, pretraining, retrieval organization, data-quality triage, and ranking cases for human review. It also works as a companion to supervised learning: clusters can guide stratified sampling, anomaly scores can become features, and learned representations can reduce label requirements.
It's especially valuable when the organization can act on hypotheses iteratively. Analysts can inspect a proposed group, domain experts can name recurring patterns, and experiments can validate interventions. That feedback loop turns ambiguous structure into knowledge. A one-off algorithm with no reviewer, owner, or decision attached is unlikely to earn its maintenance cost.
Don't use it merely because labels are inconvenient. If the goal is to predict a known target—chargeback, cancellation, component failure—and enough representative labels exist, a supervised baseline provides a direct loss and clearer evaluation. Weak supervision, active learning, or careful annotation may outperform endless attempts to infer the target indirectly.
Avoid high-stakes automated decisions based solely on unlabeled group membership. Credit, employment, healthcare, and access control require stronger evidence, fairness analysis, explanations, and human governance. Even apparently neutral behavior vectors can proxy sensitive attributes. Exploration can flag patterns for investigation; it shouldn't quietly become a policy engine.
Scale and geometry affect the choice too. Centroid methods are excellent for large, roughly convex groups and straightforward assignment. Density methods shine when noise and irregular shapes matter, but parameter selection and varying density complicate them. Graph and spectral methods reveal nonlinear boundaries but can consume substantial memory. Deep representation models earn their complexity with abundant unstructured data, not with twelve clean numeric columns.
A practical rule is to start with the simplest baseline that could plausibly work. Build a standardized K-Means, PCA, or Isolation Forest pipeline; inspect and validate it; then introduce a more elaborate method only to address an observed failure. Complexity should purchase something measurable—better stability, reviewer precision, latency, or downstream lift—not merely a more fashionable architecture.
Governance should match impact. Low-stakes content organization may need lightweight review and drift monitoring. A model that prioritizes investigations needs audit logs, reviewer feedback, and escalation rules. Document excluded features, known blind spots, retraining cadence, and the meaning of scores. That record prevents exploratory outputs from acquiring authority they never earned.
Wrapping Up
The durable lesson is that unsupervised learning doesn't remove the need for judgment; it concentrates judgment around representation, assumptions, and validation. Today, take one unlabeled dataset, define the decision it could inform, build the smallest reproducible baseline, and reserve a later time window before looking at the result.
Further Reading

Hermes Smith